Securing server infrastructure clouds using Falco, Prometheus, Grafana and Docker
I was recently looking for a way to keep tabs on our containers and applications at work; specifically was interested on detecting anomalies in the configuration and after a little research, I stumbled on Falco.
What I found was a very complete Open Source platform with lots of features and excellent documentation, so I tough on sharing my experience with you.
What will be covered in this article?
- How to install Falco agent on the host that you want to monitor for events (anomalies/ violations)
- How to tune Falco to reduce false positives and get the information you really need
- How to use Prometheus to collect Falco events into a central location, with the help of the exporters and a scrapper.
- Finally, how to connect the scrapper with Grafana for visualization and alerting
What do you need for this tutorial?
- A machine or machines with Linux installed. A virtual machine should work.
- You will need superuser permissions to be able to install/ setup Docker, RPM and systemd processes
- We will use Docker containers so basic knowledge of Docker is required
- Working knowledge of Python/ Bash, as we will write a few scripts to test and improve our configuration.
At the end you will be able to setup each one of the following components:
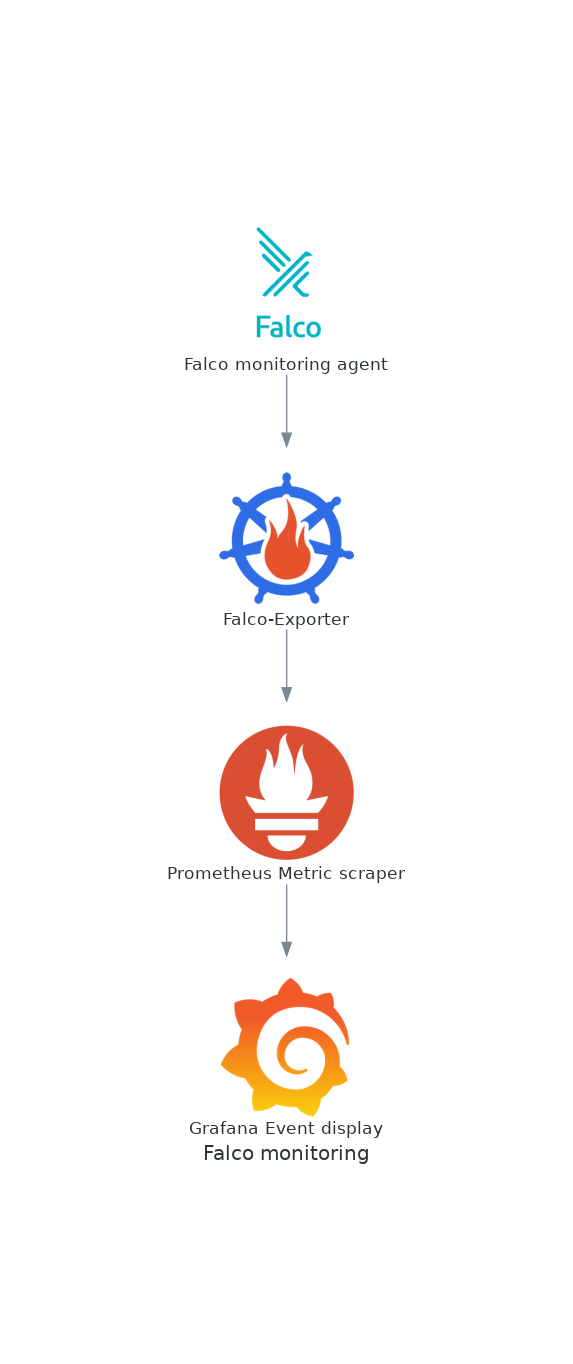
Don't be intimidated, links to documentation and explanation of each one of these tasks will be provided as we move along.
What is Falco?
The best way to describe this tool is to learn what it can do:
Falco can detect and alert on any behavior that involves making Linux system calls. Falco alerts can be triggered by the use of specific system calls, their arguments, and by properties of the calling process. For example, Falco can easily detect incidents including but not limited to:
- A shell is running inside a container or pod in Kubernetes.
- A container is running in privileged mode, or is mounting a sensitive path, such as /proc, from the host.
- A server process is spawning a child process of an unexpected type.
- Unexpected read of a sensitive file, such as /etc/shadow.
- A non-device file is written to /dev.
- A standard system binary, such as ls, is making an outbound network connection.
- A privileged pod is started in a Kubernetes cluster.
Installation
I will install Falco using an RPM (similar instructions exist for apt-get, and even Docker containers). In my case I felt the native installation was the best, and the RPM made it very easy to do:
```shell=
[josevnz@macmini2 ~]$ sudo -i dnf install https://download.falco.org/packages/rpm/falco-0.31.1-x86_64.rpm
Last metadata expiration check: 2:53:53 ago on Sun 01 May 2022 04:13:09 PM EDT.
falco-0.31.1-x86_64.rpm 1.7 MB/s | 12 MB 00:07
Dependencies resolved.
==============================================================================================================================================================================================================================================================
Package Architecture Version Repository Size
==============================================================================================================================================================================================================================================================
Installing:
falco x86_64 0.31.1-1 @commandline 12 M
Installing dependencies:
dkms noarch 2.8.1-4.20200214git5ca628c.fc30 updates 78 k
elfutils-libelf-devel x86_64 0.179-2.fc30 updates 27 k
kernel-devel x86_64 5.6.13-100.fc30 updates 14 M
Transaction Summary
Install 4 Packages
Total size: 26 M
Total download size: 14 M
Installed size: 92 M
Is this ok [y/N]: y
Downloading Packages:
(1/3): elfutils-libelf-devel-0.179-2.fc30.x86_64.rpm 253 kB/s | 27 kB 00:00
(2/3): dkms-2.8.1-4.20200214git5ca628c.fc30.noarch.rpm 342 kB/s | 78 kB 00:00
(3/3): kernel-devel-5.6.13-100.fc30.x86_64.rpm 1.9 MB/s | 14 MB 00:07
Total 1.8 MB/s | 14 MB 00:07
Running transaction check
Transaction check succeeded.
Running transaction test
Transaction test succeeded.
Running transaction
Preparing : 1/1
Installing : kernel-devel-5.6.13-100.fc30.x86_64 1/4
Running scriptlet: kernel-devel-5.6.13-100.fc30.x86_64 1/4
Installing : elfutils-libelf-devel-0.179-2.fc30.x86_64 2/4
Installing : dkms-2.8.1-4.20200214git5ca628c.fc30.noarch 3/4
Running scriptlet: dkms-2.8.1-4.20200214git5ca628c.fc30.noarch 3/4
Running scriptlet: falco-0.31.1-1.x86_64 4/4
Installing : falco-0.31.1-1.x86_64 4/4
Running scriptlet: falco-0.31.1-1.x86_64
# Basic configuration

Unless we want to do very basic output processing, we want to enable the json output:

```yaml=
# Whether to output events in json or text
json_output: true
It will become evident why pretty soon.
Next start the falcon agent:
```shell= [josevnz@macmini2 falco]$ sudo systemctl start falco.service [josevnz@macmini2 falco]$ sudo systemctl status falco.service ● falco.service - Falco: Container Native Runtime Security Loaded: loaded (/usr/lib/systemd/system/falco.service; disabled; vendor preset: disabled) Active: active (running) since Sun 2022-05-01 19:20:52 EDT; 1s ago Docs: https://falco.org/docs/ Process: 26887 ExecStartPre=/sbin/modprobe falco (code=exited, status=0/SUCCESS) Main PID: 26888 (falco) Tasks: 1 (limit: 2310) Memory: 65.8M CGroup: /system.slice/falco.service └─26888 /usr/bin/falco --pidfile=/var/run/falco.pid
May 01 19:20:52 macmini2 systemd[1]: Starting Falco: Container Native Runtime Security... May 01 19:20:52 macmini2 systemd[1]: Started Falco: Container Native Runtime Security. May 01 19:20:52 macmini2 falco[26888]: Falco version 0.31.1 (driver version b7eb0dd65226a8dc254d228c8d950d07bf3521d2) May 01 19:20:52 macmini2 falco[26888]: Falco initialized with configuration file /etc/falco/falco.yaml May 01 19:20:52 macmini2 falco[26888]: Loading rules from file /etc/falco/falco_rules.yaml: May 01 19:20:53 macmini2 falco[26888]: Loading rules from file /etc/falco/falco_rules.local.yaml: May 01 19:20:54 macmini2 falco[26888]: Loading rules from file /etc/falco/k8s_audit_rules.yaml:
# Testing default configuration

Depending on your [configuration](https://falco.org/docs/configuration/), you may or may not get any events right after starting falco:

```shell=
[josevnz@macmini2 falco]$ sudo journalctl --unit falco --follow
-- Logs begin at Tue 2021-05-25 00:15:22 EDT. --
May 01 19:20:52 macmini2 systemd[1]: Starting Falco: Container Native Runtime Security...
May 01 19:20:52 macmini2 systemd[1]: Started Falco: Container Native Runtime Security.
May 01 19:20:52 macmini2 falco[26888]: Falco version 0.31.1 (driver version b7eb0dd65226a8dc254d228c8d950d07bf3521d2)
May 01 19:20:52 macmini2 falco[26888]: Falco initialized with configuration file /etc/falco/falco.yaml
May 01 19:20:52 macmini2 falco[26888]: Loading rules from file /etc/falco/falco_rules.yaml:
May 01 19:20:53 macmini2 falco[26888]: Loading rules from file /etc/falco/falco_rules.local.yaml:
May 01 19:20:54 macmini2 falco[26888]: Loading rules from file /etc/falco/k8s_audit_rules.yaml:
May 01 19:20:55 macmini2 falco[26888]: Starting internal webserver, listening on port 8765
Worry not. We will run a few commands that will cause Falco to record some warning and alerts, time to see how this works!
Running a privileged container
It is considered a bad practice, so let's see if this event is detected by Falco:
```shell= [josevnz@macmini2 ~]$ docker run --rm --interactive --tty --privileged --volume /etc/shadow:/mnt/shadow fedora:latest ls -l /mnt/shadow ----------. 1 root root 1198 Nov 21 20:51 /mnt/shadow
And our Falco log?

```shell=
May 01 19:29:32 macmini2 falco[26888]: {"output":"19:29:32.918828894: Informational Privileged container started (user=root user_loginuid=0 command=container:bfb9637a47a6 kind_lumiere (id=bfb9637a47a6) image=fedora:latest)","priority":"Informational","rule":"Launch Privileged Container","source":"syscall","tags":["cis","container","mitre_lateral_movement","mitre_privilege_escalation"],"time":"2022-05-01T23:29:32.918828894Z", "output_fields": {"container.id":"bfb9637a47a6","container.image.repository":"fedora","container.image.tag":"latest","container.name":"kind_lumiere","evt.time":1651447772918828894,"proc.cmdline":"container:bfb9637a47a6","user.loginuid":0,"user.name":"root"}}
It shows up as an informational event. Definitely one of those things to keep an eye on. Ask yourself if the application on the container needs elevated privileges. You also probably noticed the following:
- Each message has tags. Pay attention to the "mitre_*" ones, they do relate to the Mitre Attack knowledge base of attacks and mitigations. Yep, you will spend some time reading those.
Creating a file on the /root directory
This example shows how to abuse the root user combined with volumes in a container...
```shell= [josevnz@macmini2 ~]$ docker run --rm --interactive --tty --user root --volume /root:/mnt/ fedora:latest touch /mnt/test_file [josevnz@macmini2 ~]$
Falco reaction:

```shell=
May 01 19:32:02 macmini2 falco[26888]: {"output":"19:32:02.434286167: Informational Container with sensitive mount started (user=root user_loginuid=0 command=container:ef061174c7ef distracted_lalande (id=ef061174c7ef) image=fedora:latest mounts=/root:/mnt::true:rprivate)","priority":"Informational","rule":"Launch Sensitive Mount Container","source":"syscall","tags":["cis","container","mitre_lateral_movement"],"time":"2022-05-01T23:32:02.434286167Z", "output_fields": {"container.id":"ef061174c7ef","container.image.repository":"fedora","container.image.tag":"latest","container.mounts":"/root:/mnt::true:rprivate","container.name":"distracted_lalande","evt.time":1651447922434286167,"proc.cmdline":"container:ef061174c7ef","user.loginuid":0,"user.name":"root"}}
Sensitive mount detected!
Let's raise the stakes by creating a file on /bin
```shell= [josevnz@macmini2 ~]$ sudo -i [root@macmini2 ~]# touch /bin/should_not_be_here
What Falco thinks about this?

```shell=
May 01 19:36:41 macmini2 falco[26888]: {"output":"19:36:41.237634398: Error File below a known binary directory opened for writing (user=root user_loginuid=1000 command=touch /bin/should_not_be_here file=/bin/should_not_be_here parent=bash pcmdline=bash gparent=sudo container_id=host image=<NA>)","priority":"Error","rule":"Write below binary dir","source":"syscall","tags":["filesystem","mitre_persistence"],"time":"2022-05-01T23:36:41.237634398Z", "output_fields": {"container.id":"host","container.image.repository":null,"evt.time":1651448201237634398,"fd.name":"/bin/should_not_be_here","proc.aname[2]":"sudo","proc.cmdline":"touch /bin/should_not_be_here","proc.pcmdline":"bash","proc.pname":"bash","user.loginuid":1000,"user.name":"root"}}
An error, binary directory opened for writing. Good catch.
Defaults are not always good
After Falco is running for a while it is a good idea to get a sense of what kind of events we want to ignore and which ones we want to investigate. The first step is to get a list of all the events, using our JSON format on the payload:
```shell= sudo journalctl --unit falco --no-page --output=cat > /tmp/falco_json_lines.txt
The 'output=cat' tells journalctl to give us the message payload without timestamps (do not worry, the JSON message itself has timestamps).

```shell
Starting Falco: Container Native Runtime Security...
Started Falco: Container Native Runtime Security.
Falco version 0.31.1 (driver version b7eb0dd65226a8dc254d228c8d950d07bf3521d2)
Falco initialized with configuration file /etc/falco/falco.yaml
Loading rules from file /etc/falco/falco_rules.yaml:
Loading rules from file /etc/falco/falco_rules.local.yaml:
Loading rules from file /etc/falco/k8s_audit_rules.yaml:
Starting internal webserver, listening on port 8765
{"output":"19:29:32.918828894: Informational Privileged container started (user=root user_loginuid=0 command=container:bfb9637a47a6 kind_lumiere (id=bfb9637a47a6) image=fedora:latest)","priority":"Informational","rule":"Launch Privileged Container","source":"syscall","tags":["cis","container","mitre_lateral_movement","mitre_privilege_escalation"],"time":"2022-05-01T23:29:32.918828894Z", "output_fields": {"container.id":"bfb9637a47a6","container.image.repository":"fedora","container.image.tag":"latest","container.name":"kind_lumiere","evt.time":1651447772918828894,"proc.cmdline":"container:bfb9637a47a6","user.loginuid":0,"user.name":"root"}}
{"output":"19:32:02.434286167: Informational Container with sensitive mount started (user=root user_loginuid=0 command=container:ef061174c7ef distracted_lalande (id=ef061174c7ef) image=fedora:latest mounts=/root:/mnt::true:rprivate)","priority":"Informational","rule":"Launch Sensitive Mount Container","source":"syscall","tags":["cis","container","mitre_lateral_movement"],"time":"2022-05-01T23:32:02.434286167Z", "output_fields": {"container.id":"ef061174c7ef","container.image.repository":"fedora","container.image.tag":"latest","container.mounts":"/root:/mnt::true:rprivate","container.name":"distracted_lalande","evt.time":1651447922434286167,"proc.cmdline":"container:ef061174c7ef","user.loginuid":0,"user.name":"root"}}
So far looks interesting, but what about this?
```json lines
{"output":"23:04:10.609949471: Warning Shell history had been deleted or renamed (user=josevnz user_loginuid=1000 type=openat command=bash fd.name=/home/josevnz/.bash_history-01112.tmp name=/home/josevnz/.bash_history-01112.tmp path=
This is a normal/ legitimate operation; let's find a way to harden this rule or remove it completely.

First, open the ```/etc/falco/falco_rules.yaml``` file and look for the rule 'Delete or rename shell history' (JSON output we saw earlier):

```yaml
- list: docker_binaries
  items: [docker, dockerd, exe, docker-compose, docker-entrypoi, docker-runc-cur, docker-current, dockerd-current]

 macro: var_lib_docker_filepath
  condition: (evt.arg.name startswith /var/lib/docker or fd.name startswith /var/lib/docker)

- rule: Delete or rename shell history
  desc: Detect shell history deletion
  condition: >
    (modify_shell_history or truncate_shell_history) and
       not var_lib_docker_filepath and
       not proc.name in (docker_binaries)
  output: >
    Shell history had been deleted or renamed (user=%user.name user_loginuid=%user.loginuid type=%evt.type command=%proc.cmdline fd.name=%fd.name name=%evt.arg.name path=%evt.arg.path oldpath=%evt.arg.oldpath %container.info)
  priority:
    WARNING
  tags: [process, mitre_defense_evasion]
Falco rules are explained in detail on the official documentation; Just by looking at this piece you will notice a few things:
About the conditions:
1. Support complex logic,
2. macros like var_lib_docker_filepath.
3. lists like (docker_binaries)
4. And special variables with fields like proc.name
It is recommended that do you not change this file, and instead you override what you need on the /etc/falco/falco_rules.local.yaml
# Add new rules, like this one
# - rule: The program "sudo" is run in a container
#   desc: An event will trigger every time you run sudo in a container
#   condition: evt.type = execve and evt.dir=< and container.id != host and proc.name = sudo
#   output: "Sudo run in container (user=%user.name %container.info parent=%proc.pname cmdline=%proc.cmdline)"
#   priority: ERROR
#   tags: [users, container]

# Or override/append to any rule, macro, or list from the Default Rules
For the sake of example, say than we do care when the history of the super-user (root) is override, but everybody else if fine; the best part is that you don't have to override the whole rule.
So the original rule will get a condition appended:
- rule: Delete or rename shell history
  append: true
  condition: and user.name=root
It is always a good idea to validate than your rules are properly written; For that you need can tell Falco to check the original rules and your overrides together:
[root@macmini2 ~]# falco --validate /etc/falco/falco_rules.yaml --validate /etc/falco/falco_rules.local.yaml
Fri May  6 20:48:00 2022: Validating rules file(s):
Fri May  6 20:48:00 2022:    /etc/falco/falco_rules.yaml
Fri May  6 20:48:00 2022:    /etc/falco/falco_rules.local.yaml
/etc/falco/falco_rules.yaml: Ok
/etc/falco/falco_rules.local.yaml: Ok
Fri May  6 20:48:01 2022: Ok

# If the rules are OK, restart Falco
[root@macmini2 ~]# systemctl restart falco.service
A simple event explorer in Python
You must admit than getting a sense of what rules are noise and which ones are useful is tedious.
We need must normalize this data, we will use a python script that will: * Remove non JSON data * Aggregate event types without the timestamps * Generate a few aggregation statistics, so we can focus on the most frequent events in our system
A small python script can do the trick; I'm leaving out the UI rendering part (please check the code to see the full picture), and instead will show you the file parsing bits:
#!/usr/bin/env python3
"""
Aggregate Falco events to make it easier to override rules
Jose Vicente Nunez (kodegeek.com@protonmail.com)
"""
import json
import re
from argparse import ArgumentParser
from pathlib import Path
from rich.console import Console
from falcotutor.ui import EventDisplayApp, create_event_table, add_rows_to_create_event_table


def filter_events(journalctl_out: Path) -> dict[any, any]:
    """
    :param journalctl_out:
    :return:
    """
    with open(journalctl_out, 'r') as journalctl_file:
        for row in journalctl_file:
            if re.search("^{", row):
                data = json.loads(row)
                if 'rule' in data and 'output_fields' in data:
                    yield data


def aggregate_events(local_event: dict[any, any], aggregated_events: dict[any, any]):
    rule = local_event['rule']
    if rule not in aggregated_events:
        aggregated_events[rule] = {
            'count': 0,
            'priority': local_event['priority'],
            'last_timestamp': "",
            'last_fields': ""
        }
    aggregated_events[rule]['count'] += 1
    aggregated_events[rule]['last_timestamp'] = local_event['time']
    del local_event['output_fields']['evt.time']
    aggregated_events[rule]['last_fields'] = json.dumps(local_event['output_fields'], indent=True)


if __name__ == "__main__":
    CONSOLE = Console()
    AGGREGATED = {}
    PARSER = ArgumentParser(description=__doc__)
    PARSER.add_argument(
        "falco_event",
        action="store"
    )
    ARGS = PARSER.parse_args()
    try:
        event_table = create_event_table()
        for event in filter_events(ARGS.falco_event):
            aggregate_events(local_event=event, aggregated_events=AGGREGATED)
        add_rows_to_create_event_table(AGGREGATED, event_table)
        EventDisplayApp.run(
            event_file=ARGS.falco_event,
            title="Falco aggregated events report",
            event_table=event_table
        )
    except KeyboardInterrupt:
        CONSOLE.print("[bold]Program interrupted...[/bold]")
Once the file is loaded as a dictionary we only need to iterate to it to aggregate the events, then show the results as a neat table sorted by count:

Showing the falco rules
If you are like me, you are always looking at the /etc/falco/falco_rules.yaml file to understand what is being monitored; A brief view of those rules (without looking at the verbose YAML file with comments) is a nice addition:
#!/usr/bin/env python3
"""
Show brief content of default Falco rule YAML files
Jose Vicente Nunez (kodegeek.com@protonmail.com)
"""
from argparse import ArgumentParser
from pathlib import Path
from rich.console import Console
import yaml
from falcotutor.ui import create_rules_table, add_rows_to_create_rules_table, RulesDisplayApp


def load_rulez(falco_rulez: Path) -> dict[any, any]:
    rulez = {}
    with open(falco_rulez, 'rt') as falco_file:
        for rule_data in yaml.full_load(falco_file):
            if 'rule' in rule_data:
                rule_name = rule_data['rule']
                del rule_data['rule']
                rulez[rule_name] = rule_data
    return rulez


if __name__ == "__main__":
    CONSOLE = Console()
    AGGREGATED = {}
    PARSER = ArgumentParser(description=__doc__)
    PARSER.add_argument(
        "falco_rules",
        action="store"
    )
    ARGS = PARSER.parse_args()
    try:
        RULES = load_rulez(ARGS.falco_rules)
        RULE_TBL = create_rules_table()
        add_rows_to_create_rules_table(lrules=RULES, rules_tbl=RULE_TBL)
        RulesDisplayApp.run(
            rules_file=ARGS.falco_rules,
            title="Falco brief rule display",
            rules_table=RULE_TBL
        )
    except KeyboardInterrupt:
        CONSOLE.print("[bold]Program interrupted...[/bold]")
You could improve this script by adding rule filtering by certain criteria, for example (rule name, priority, enabled/ disabled). This version doesn't do any filtering:

Falco integrations
You probably noticed 2 things from our earlier experimentation:
- The payload of the events do not have the host; If you want to locate an offending server, you need to improve how a multi-host event is reported (parsing a journalctl file from many hosts is not practical).
- We want to get alerts in a centralized location; it would be nice to have a way to "push" those events instead of us going to fish
It is time to consolidate those alerts in a single place.
Falco exporter
The Falco exporter will allow us to share the falco alerts with Prometheus scrapper; We need first to enable gRPC in the /etc/falco/falco.yaml
```yaml=
gRPC server using an unix socket
grpc: enabled: true bind_address: "unix:///var/run/falco.sock" # when threadiness is 0, Falco automatically guesses it depending on the number of online cores threadiness: 0
gRPC output service.
By default it is off.
By enabling this all the output events will be kept in memory until you read them with a gRPC client.
Make sure to have a consumer for them or leave this disabled.
grpc_output: enabled: true
Restart Falco:

```shell=
[root@macmini2 ~]# systemctl restart falco.service
[root@macmini2 ~]# systemctl status falco.service
● falco.service - Falco: Container Native Runtime Security
   Loaded: loaded (/usr/lib/systemd/system/falco.service; disabled; vendor preset: disabled)
   Active: active (running) since Sun 2022-05-01 20:35:01 EDT; 26s ago
     Docs: https://falco.org/docs/
  Process: 28285 ExecStartPre=/sbin/modprobe falco (code=exited, status=0/SUCCESS)
 Main PID: 28288 (falco)
    Tasks: 11 (limit: 2310)
   Memory: 80.9M
   CGroup: /system.slice/falco.service
           └─28288 /usr/bin/falco --pidfile=/var/run/falco.pid

May 01 20:35:01 macmini2 systemd[1]: Starting Falco: Container Native Runtime Security...
May 01 20:35:01 macmini2 systemd[1]: Started Falco: Container Native Runtime Security.
May 01 20:35:01 macmini2 falco[28288]: Falco version 0.31.1 (driver version b7eb0dd65226a8dc254d228c8d950d07bf3521d2)
May 01 20:35:01 macmini2 falco[28288]: Falco initialized with configuration file /etc/falco/falco.yaml
May 01 20:35:01 macmini2 falco[28288]: Loading rules from file /etc/falco/falco_rules.yaml:
May 01 20:35:02 macmini2 falco[28288]: Loading rules from file /etc/falco/falco_rules.local.yaml:
May 01 20:35:03 macmini2 falco[28288]: Loading rules from file /etc/falco/k8s_audit_rules.yaml:
May 01 20:35:04 macmini2 falco[28288]: Starting internal webserver, listening on port 8765
May 01 20:35:04 macmini2 falco[28288]: gRPC server threadiness equals to 2
May 01 20:35:04 macmini2 falco[28288]: Starting gRPC server at unix:///var/run/falco.sock
Quickly make sure is OK (reminder, Falco agent is running on macmini2):
josevnz@raspberrypi:~$ curl --fail http://macmini2:8765/healthz
{"status": "ok"}josevnz@raspberrypi:~$
Then we run the falco-exporter. To make it easier, we will use a Docker container with a few overrides in the command line.
```shell= [root@macmini2 ~]# docker run --restart always --name falco-exporter --detach --volume /var/run/falco.sock:/var/run/falco.sock --network=host falcosecurity/falco-exporter --listen-address 192.168.1.16:9376 7d157af0251ea4bc73b8c355a74eaf4dd24a5348cbe3f5f2ea9d7147c6c366c8 [root@macmini2 ~]# docker logs falco-exporter 2022/05/02 00:56:30 connecting to gRPC server at unix:///var/run/falco.sock (timeout 2m0s) 2022/05/02 00:56:30 listening on http://192.168.1.16:9376/metrics 2022/05/02 00:56:30 connected to gRPC server, subscribing events stream 2022/05/02 00:56:30 ready
Check with CURL if the URL is reachable
[root@macmini2 ~]# curl http://192.168.1.16:9376/metrics
HELP go_gc_duration_seconds A summary of the pause duration of garbage collection cycles.
TYPE go_gc_duration_seconds summary
go_gc_duration_seconds{quantile="0"} 0 go_gc_duration_seconds{quantile="0.25"} 0 go_gc_duration_seconds{quantile="0.5"} 0 go_gc_duration_seconds{quantile="0.75"} 0 go_gc_duration_seconds{quantile="1"} 0 go_gc_duration_seconds_sum 0 go_gc_duration_seconds_count 0
HELP go_goroutines Number of goroutines that currently exist.
TYPE go_goroutines gauge
go_goroutines 18
HELP go_info Information about the Go environment.
TYPE go_info gauge
go_info{version="go1.14.15"} 1
HELP go_memstats_alloc_bytes Number of bytes allocated and still in use.
TYPE go_memstats_alloc_bytes gauge
go_memstats_alloc_bytes 2.011112e+06
For completeness, let me show you also how to capture the host performance metrics [using the node exporter](https://prometheus.io/docs/guides/node-exporter/) (we will use it later to keep an eye on how many resources are used by Falco and to make sure our installation is not hurting the server):

```shell=
docker run --detach --net="host" --pid="host" --volume "/:/host:ro,rslave" quay.io/prometheus/node-exporter:latest --path.rootfs=/host
The node-exporter and the falco-exporter will run on every host that needs their data scrapped, now you need wait to collect all these metrics into a single location, for that will use the Prometheus agent:
```yaml=
/etc/prometheus.yaml on raspberrypi
global: scrape_interval: 30s evaluation_interval: 30s scrape_timeout: 10s external_labels: monitor: 'nunez-family-monitor'
scrape_configs: - job_name: 'falco-exporter' static_configs: - targets: ['macmini2.home:9376'] - job_name: 'node-exporter' static_configs: - targets: ['macmini2.home:9100', 'raspberrypi.home:9100', 'dmaf5:9100'] - job_name: 'docker-exporter' static_configs: - targets: ['macmini2.home:9323', 'raspberrypi.home:9323', 'dmaf5:9323']
tls_config:
  insecure_skip_verify: true
The make sure the Prometheus scrapper can talk with each one of the nodes. We visit the web UI:

Good, Prometheus is able to scrap Falco. We can even run a simple query to see a few events:

Next we need to setup the UI view for the events, for that we will use Grafana.
There are many ways to install it, in my case [I will use a Grafana Docker container](https://grafana.com/docs/grafana/latest/installation/docker/):
(I will run Grafana on the same host where prometheus is running: raspberripi.home)
```shell=
docker pull grafana/grafana:main-ubuntu
mkdir -p /data/grafana
chown syslog /data/grafana
docker run --user 104 --name grafana --detach --tty --volume /data/grafana:/var/lib/grafana -p 3000:3000 grafana/grafana:main-ubuntu
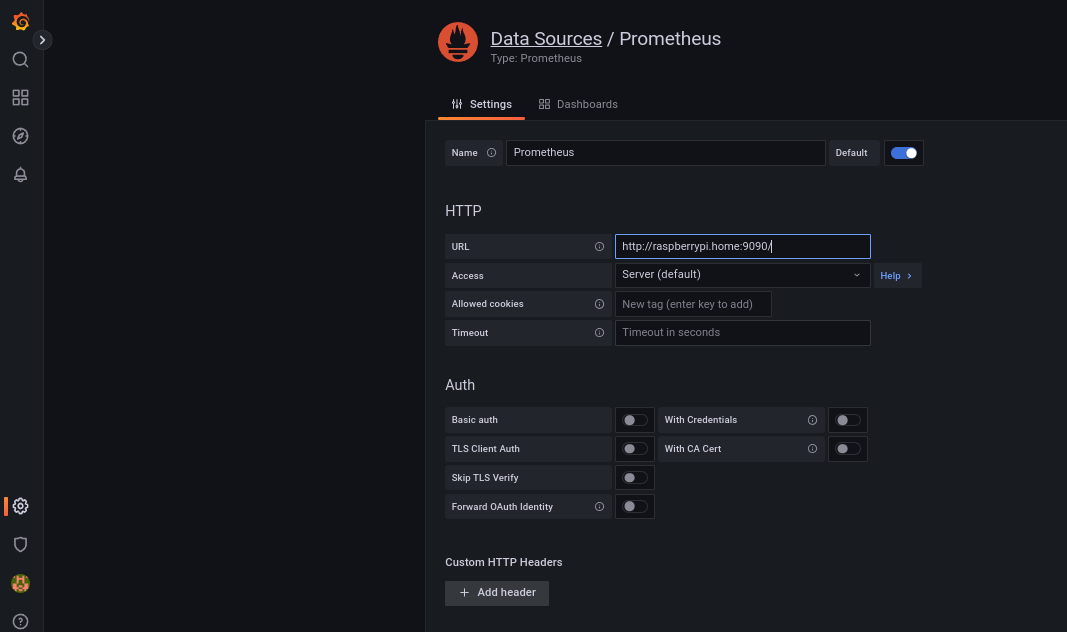
After Grafana comes up, you will need to change your password and will also need to connect with Prometheus:
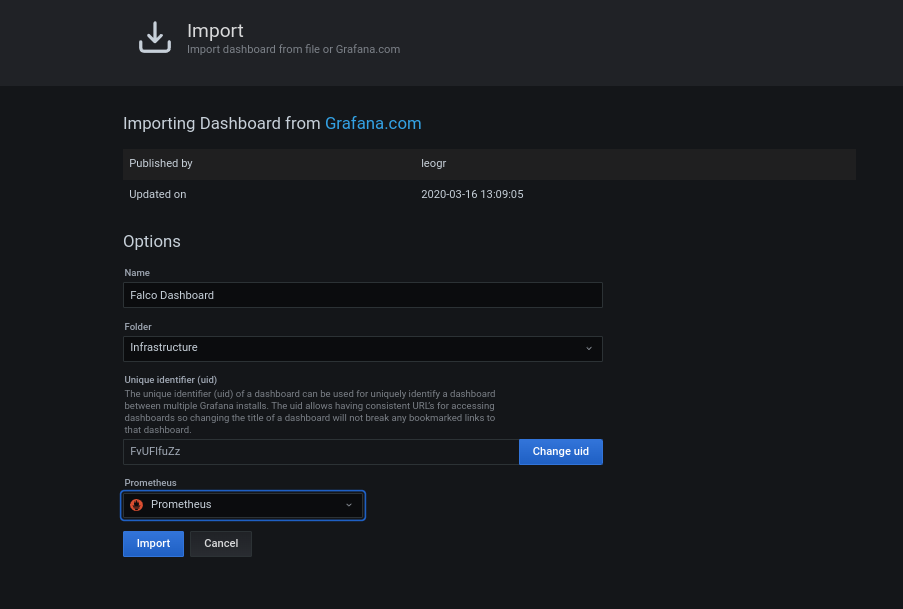
Once Grafana is up, we can import the Falco dashboard as explained here.
Once the dashboard is imported we can generate a few events to trigger Falco on the host where is installed:
shell=
[root@macmini2 ~]# for i in $(seq 1 60); do docker run --rm --interactive --tty --privileged fedora:latest /bin/bash -c ls; touch /root/test; rm -f /root/test; sleep 1; done
After a little you should see something like this on your Grafana Dashboard:
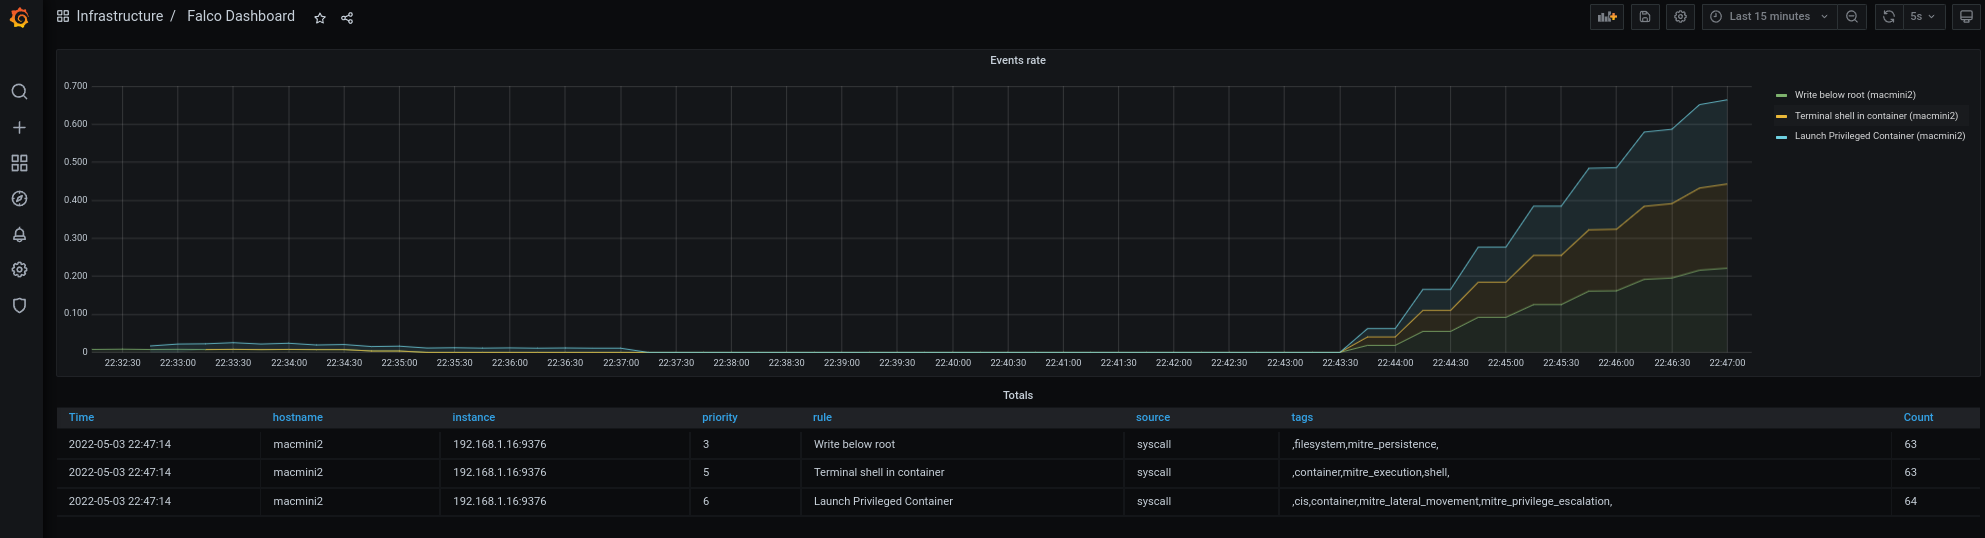
The events are flowing, and you can see from which host they came from.
Creating alerts for your Falco events
Ideally if you have the Falco events in Grafana, you can make these actionable items and generate alerts from then.
I don't want to get bombarded by non-critical alerts, so the first thing to know is to what level of events to filter:
| ID | Priority | Ignore? |
|---|---|---|
| 7 | debug | Yes |
| 6 | informational | Yes |
| 5 | notice | Yes |
| 4 | warning | Yes |
| 3 | error | No |
| 2 | critical | No |
| 1 | alert | No |
| 0 | emergency | No |
Anything with priority below 3 will be treated as an alert.
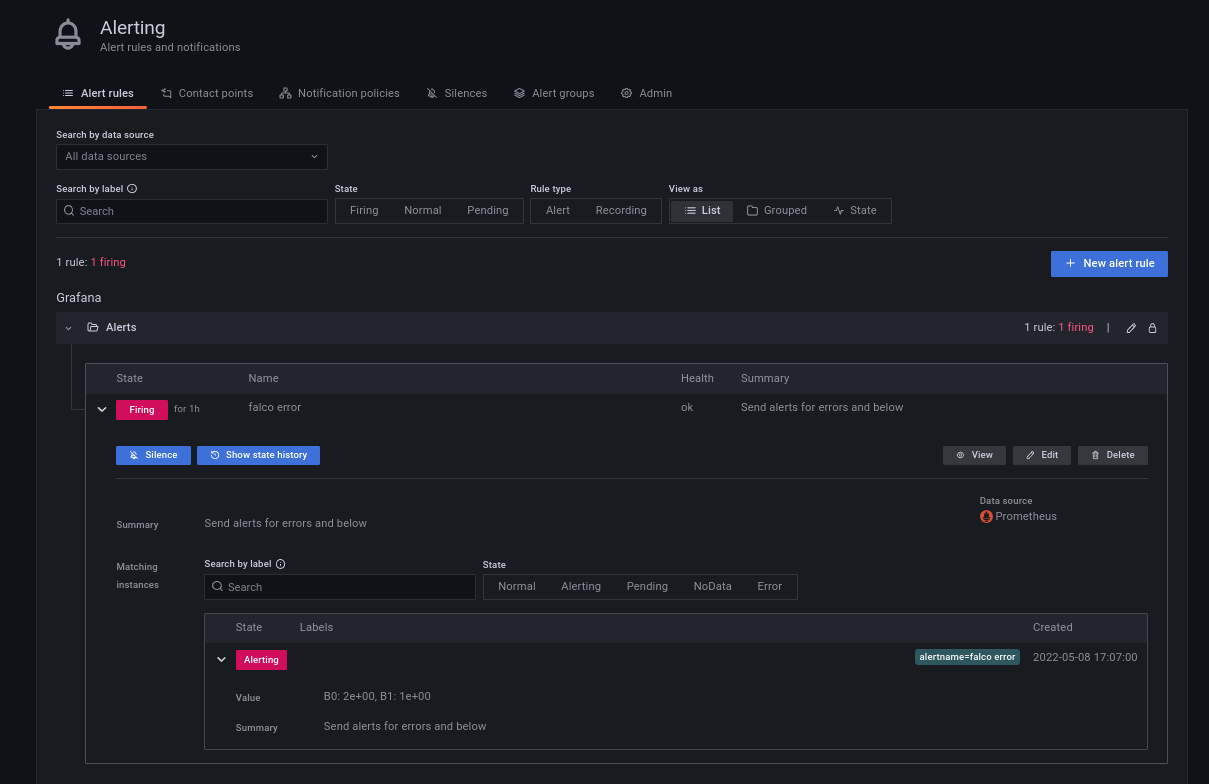
Grafana has good documentation on how to setup an alert, I will show here the end result only;
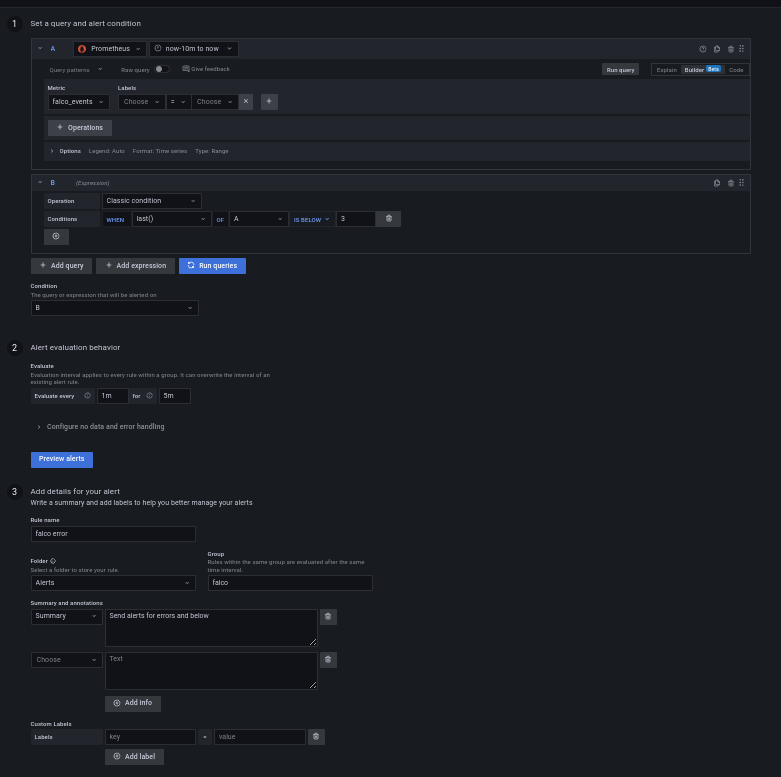
Next step is to send the alerts somewhere.
Alerts need to go somewhere: Defining a contact point using Discord
For this example we will use Discord as the end for the alerts; Discord has a very detailed guide on how to setup a WebHook, for that reason I will only show you here the end results of my discord Webhook:
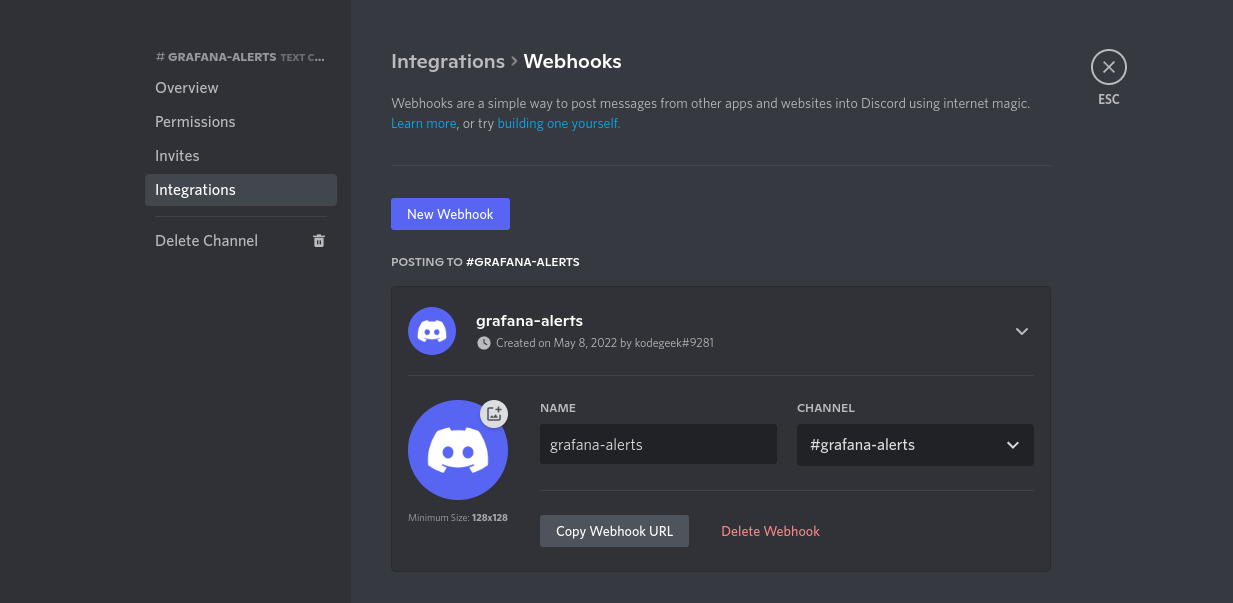
We copy that URL and then will configure a new Grafana contact point that uses our Discord webhook (we are setting this a default contact point for all the alerts):
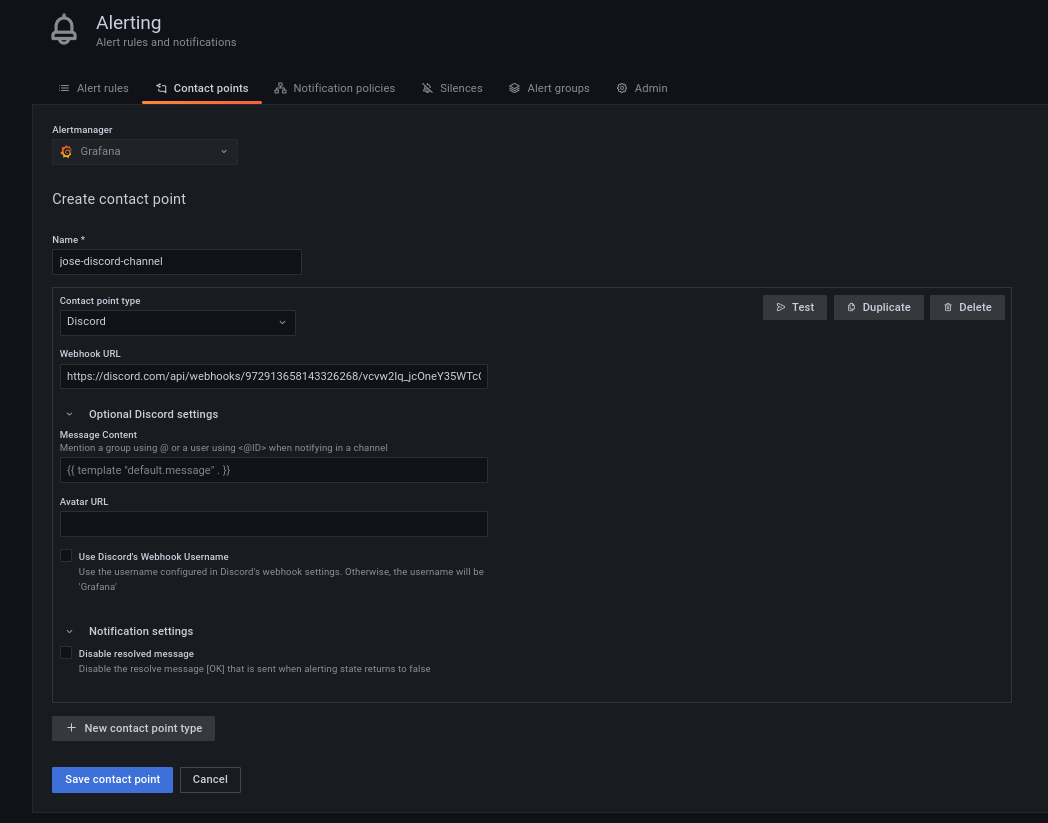
From there we can send a test message to Discord, just to confirm this pipeline works:
Getting closer; By now if we go back to our alert definition we should see it is on the 'firing' state:
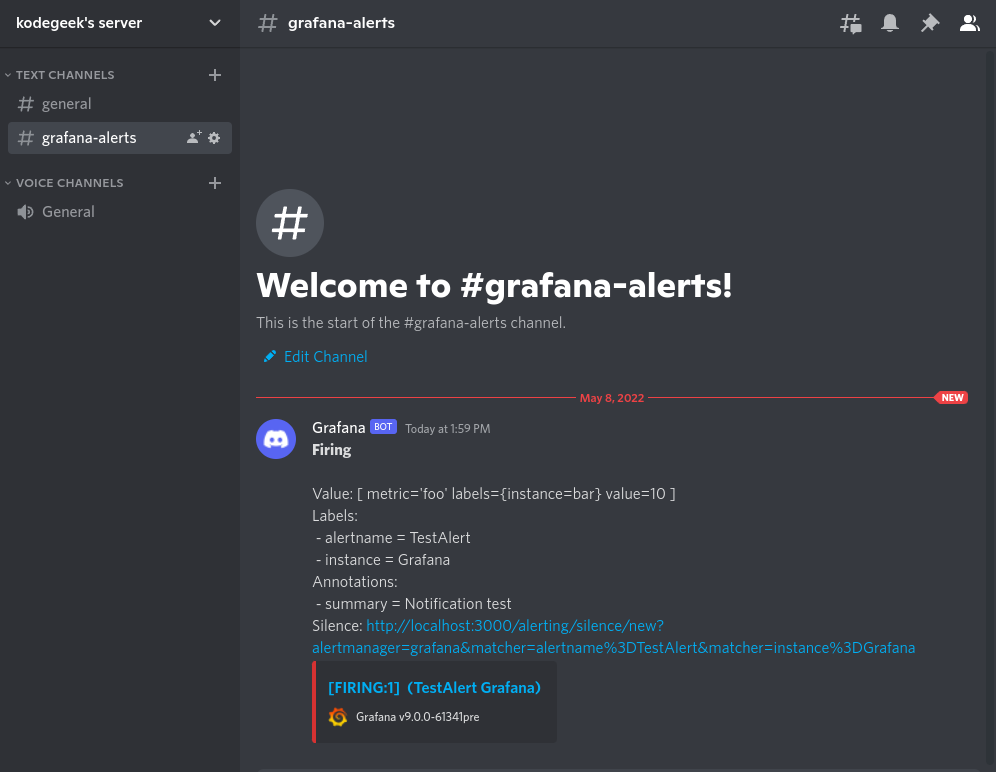
And if everything goes well we see also our first Falco alert in Discord:
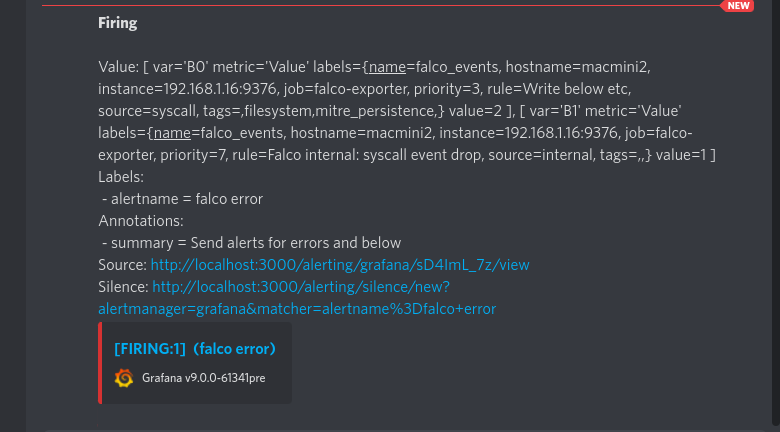
We can see here all the fields we get on the journalctl output, difference is that all these messages will come from all the servers where you define the Falco-Prometheus-Grafana bridge.
Honorable mention: aggregating alerts using Falcon Sidekick/ Falcon Sidekick-UI
Falco Sidekick is another way to gather and send events to other destinations, like the Falco Sidekick-UI. But it won't tell you the originating host (At least until Falco 0.31.1).
This is most likely not an issue for an alert coming from a K8s cluster or a containerized application where the image name will give you plenty of information but if is your event happens on a bare-metal environment, and you have more than 2 machines it will become a headache.
For that reason I won't cover Sidekick here, you may want to stick with the Grafana integration for the time being.
Learning more
- Falco has a great interactive learning environment; You should try it to see what else is possible, there is a lot of things I did not cover here, like rule exceptions for example.
- Did you know that Falco can be extended using plugins? You can have fun and learn using C++ or Go as the language of choice
- The Falco blog has lots of interesting articles, including posts for the latest threats.
- The project has a very active community on many channels. Pick yours and explore.
Feel free to fork my code and report any issues if you find any. But more important, explore and learn by doing.